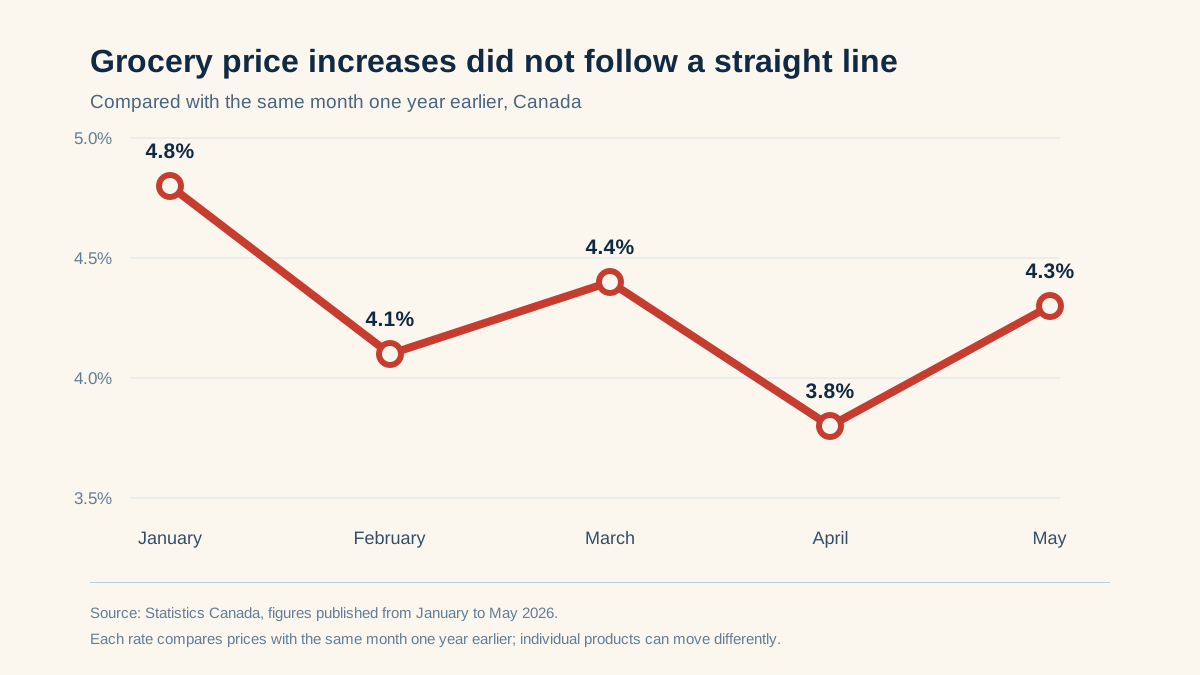
At first glance, April’s number looked like welcome news. Food purchased from stores cost 3.8% more than a year earlier, down from 4.4% in March. But nobody saw a 0.6-point discount appear at the checkout.
That distinction matters: the rise in grocery prices slowed in April, but prices did not fall. The next release also showed that it was too early to call this a steady trend. In May, the annual increase rose again to 4.3%.
What the 3.8% rate actually measures
Statistics Canada compares the cost of a representative basket in April 2026 with the same basket in April 2025. The result is a national average built from many food categories.
For a simple illustration, a $100 basket in April 2025 would have cost about $103.80 one year later if it had followed the national average exactly. That example explains the rate; it does not predict your next bill.
Your experience can be quite different. A household that buys beef, coffee, and fresh vegetables regularly may face a larger increase than one that purchases more dairy products, legumes, or store brands.
The 3.8% figure shows the general direction. It does not describe every basket.
| Month in 2026 | Increase from the same month one year earlier |
|---|---|
| January | 4.8% |
| February | 4.1% |
| March | 4.4% |
| April | 3.8% |
| May | 4.3% |
Why a slower rise did not feel like relief
A lower inflation rate does not return prices to their earlier level. It only means they are rising more slowly than during the comparison period.
In February 2026, grocery prices were 30.1% higher than in February 2021, according to Statistics Canada. The Bank of Canada uses a different starting point and estimates that grocery prices rose about 22% from 2022, compared with 13% for other consumer prices.
Those percentages should not be added because they cover different periods. Together, they explain why one slower month can feel disconnected from the price of coffee, bread, or ground beef.
The products that can pull your basket away from the average
The April release does not provide a neat list of products that “caused” the 3.8% rate. Claiming that three or four items drove the entire result would overstate what the data shows. Figures around April do reveal where some of the most visible pressure remained.
Beef remained expensive
In February, fresh or frozen beef cost 13.9% more than a year earlier. That was slower than the 18.8% increase recorded in January, but still far above the overall grocery rate.
Canada’s Food Price Report 2026 links continued meat pressure to fewer cattle being available across North America after several years of drought in major production regions.
Fresh vegetables changed direction quickly
Fresh vegetable prices were 7.8% higher than a year earlier in March, 4.1% higher in April, and 9.0% higher in May. Weather, growing conditions, origin, and transportation can move fresh produce prices much faster than the grocery average.
Coffee was still carrying the shocks of 2025
Coffee cost roughly 31% more in December 2025 than one year earlier, according to the Bank of Canada. Higher coffee prices on world markets and supply problems do not reach Canadian shelves immediately: some increases can take six to nine months to show up fully in stores.
The $17,571.79 family estimate is a forecast, not your bill
Canada’s Food Price Report 2026 forecasts overall food-price growth of 4% to 6% this year. For the four-person family used in its scenario, annual food spending could reach $17,571.79, up to $994.63 more than in 2025.
That estimate is based on one type of household and a set of assumptions about how it eats. It is not a universal grocery bill. Region, age, dietary habits, and meals purchased outside the home can change the total substantially.
The forecast gives a useful sense of scale. Your own receipts remain more useful for understanding your budget.
Canada’s grocery pressure does not need a sensational ranking
International comparisons can be informative when they use the same food definition, month, and method. Rankings become fragile when overall food inflation in one country is compared with food purchased from stores in another.
Canadian data already makes the issue clear. In April, grocery prices increased 3.8% while prices in general rose 2.8%. In May, the gap was 4.3% versus 3.2%, marking the 16th consecutive month in which grocery prices rose faster than the overall cost of living.
That is a meaningful strain on household budgets without calling Canada the “worst rich country” for groceries.
Track a short list of groceries you buy often
Choose five to ten regular products—milk, eggs, bread, coffee, cereal, apples, and one or two proteins. Record the price, package size, and unit price. A familiar price attached to a smaller package may point to shrinkflation.
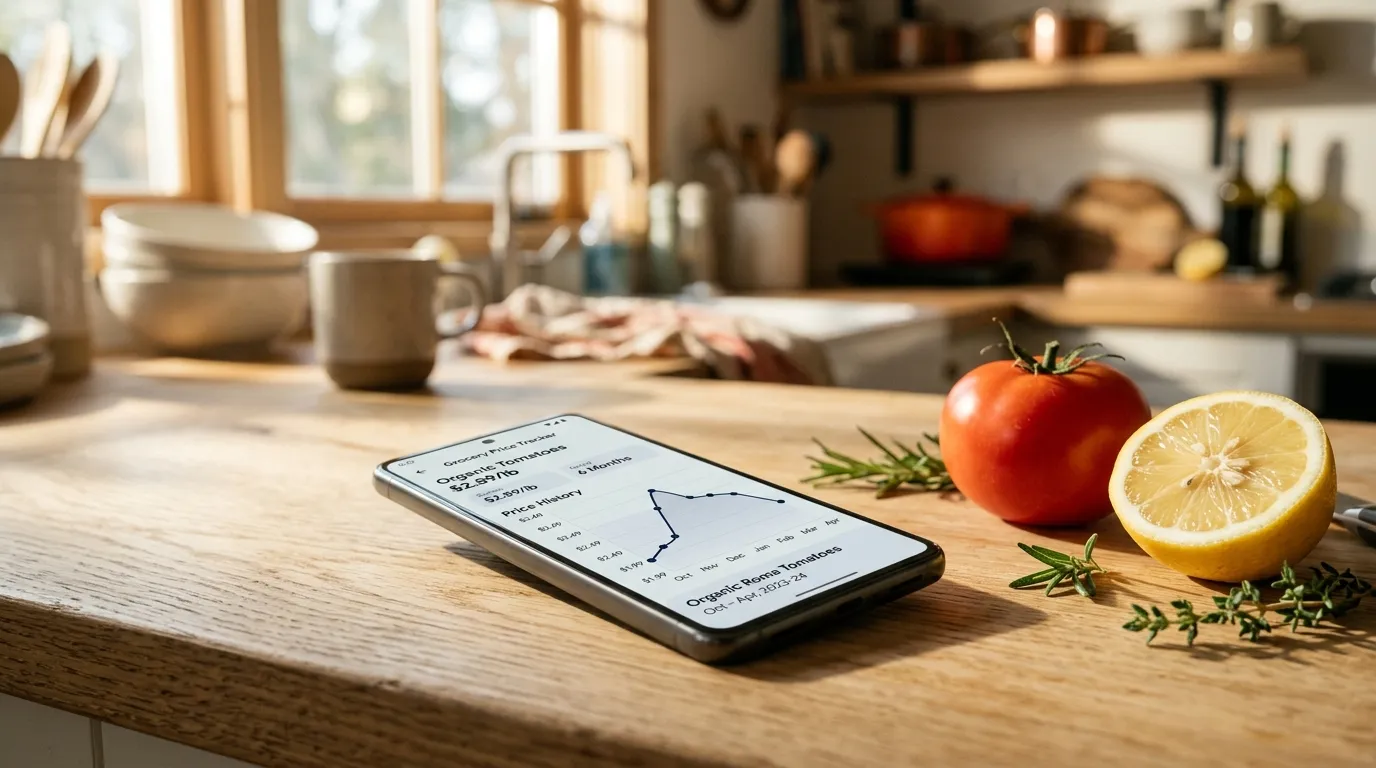
After a few grocery runs, you will see which items are moving your bill and whether a flyer special is genuinely unusual. The BarcodeVibe price tracker can act as a memory for this short list without pretending that a national average describes every local store.
For a broader routine, see our guide to saving on groceries in Canada in 2026. The next Statistics Canada release will describe the national trend; your price history will show what is happening in your basket.